
Seascape Alaska 6: Gulf of Alaska Transit Mapping (EX2307)
Seafloor Mapping the Inside Passage: Story of a Self-Fulfilling Prophecy
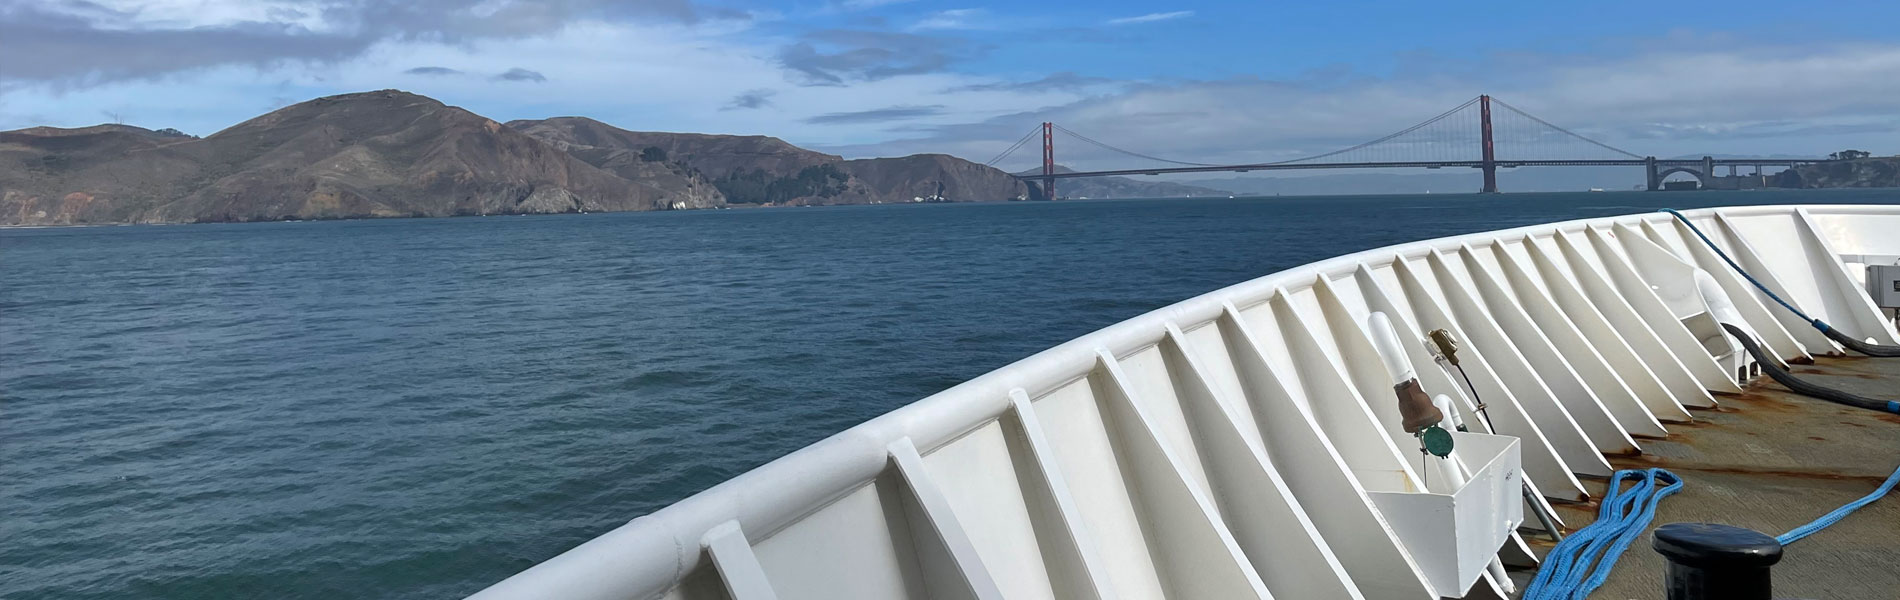
Stormy seas forced NOAA Ship Okeanos Explorer to
take refuge in the Clarence Strait of southeast Alaska’s Inside Passage during the Seascape Alaska 6 expedition.
Okeanos Explorer is the only federal vessel solely dedicated to ocean
exploration, and during mapping expeditions like those conducted during the Seascape Alaska series,
seafloor mapping is
a 24/7 operation. Mapping in the Inside Passage was not a part of the original expedition plan, but it became a historic
venture. One of the last hydrographic surveys–
surveys that map features underwater–in this location was conducted in
1920.
More than a century ago, this area was mapped using lead lines. This technique involved dropping a line with a lead weight at the end of it off a ship until the weight hit the seafloor. The length of line it took to reach the bottom was
measured to estimate depth. These measurements are known as soundings, and were recorded in fathoms (one fathom is equal to around six feet). Leadlining was a lengthy, difficult process, but essential for creating nautical charts to ensure
safe navigation by ships.
Lead lining was established in the early 1800s and was the primary seafloor mapping method until the development of
single beam sonar in the 1920s. These sonars sent one pulse of sound to the seafloor and returned one measurement.
Multibeam sonars, which send out many sound pulses and can map a much larger swath, were developed in the 1960s.
Okeanos Explorer is equipped with an EM 304 MKII multibeam sonar that emits 512 beams in one swath, able to produce up
to 1,600 soundings in one “ping” of sound. These swaths can be up to approximately 10,000 meters (6.2 miles) wide. With
lead lining expeditions only able to collect a few hundred soundings per expedition, to Okeanos Explorer multibeam sonar
collecting hundreds soundings every few seconds, the advancement in seafloor mapping technology in the last 100 years is
astounding.
The 1920 expedition report discusses the difficulties of mapping near exposed rocks and the gaps in data avoiding them
would create: “…gaps of this character are likely to remain unsurveyed for years and render a chart incomplete.” These
seafloor mappers were quite prophetic, as it would be more than 100 years until this area was mapped again.
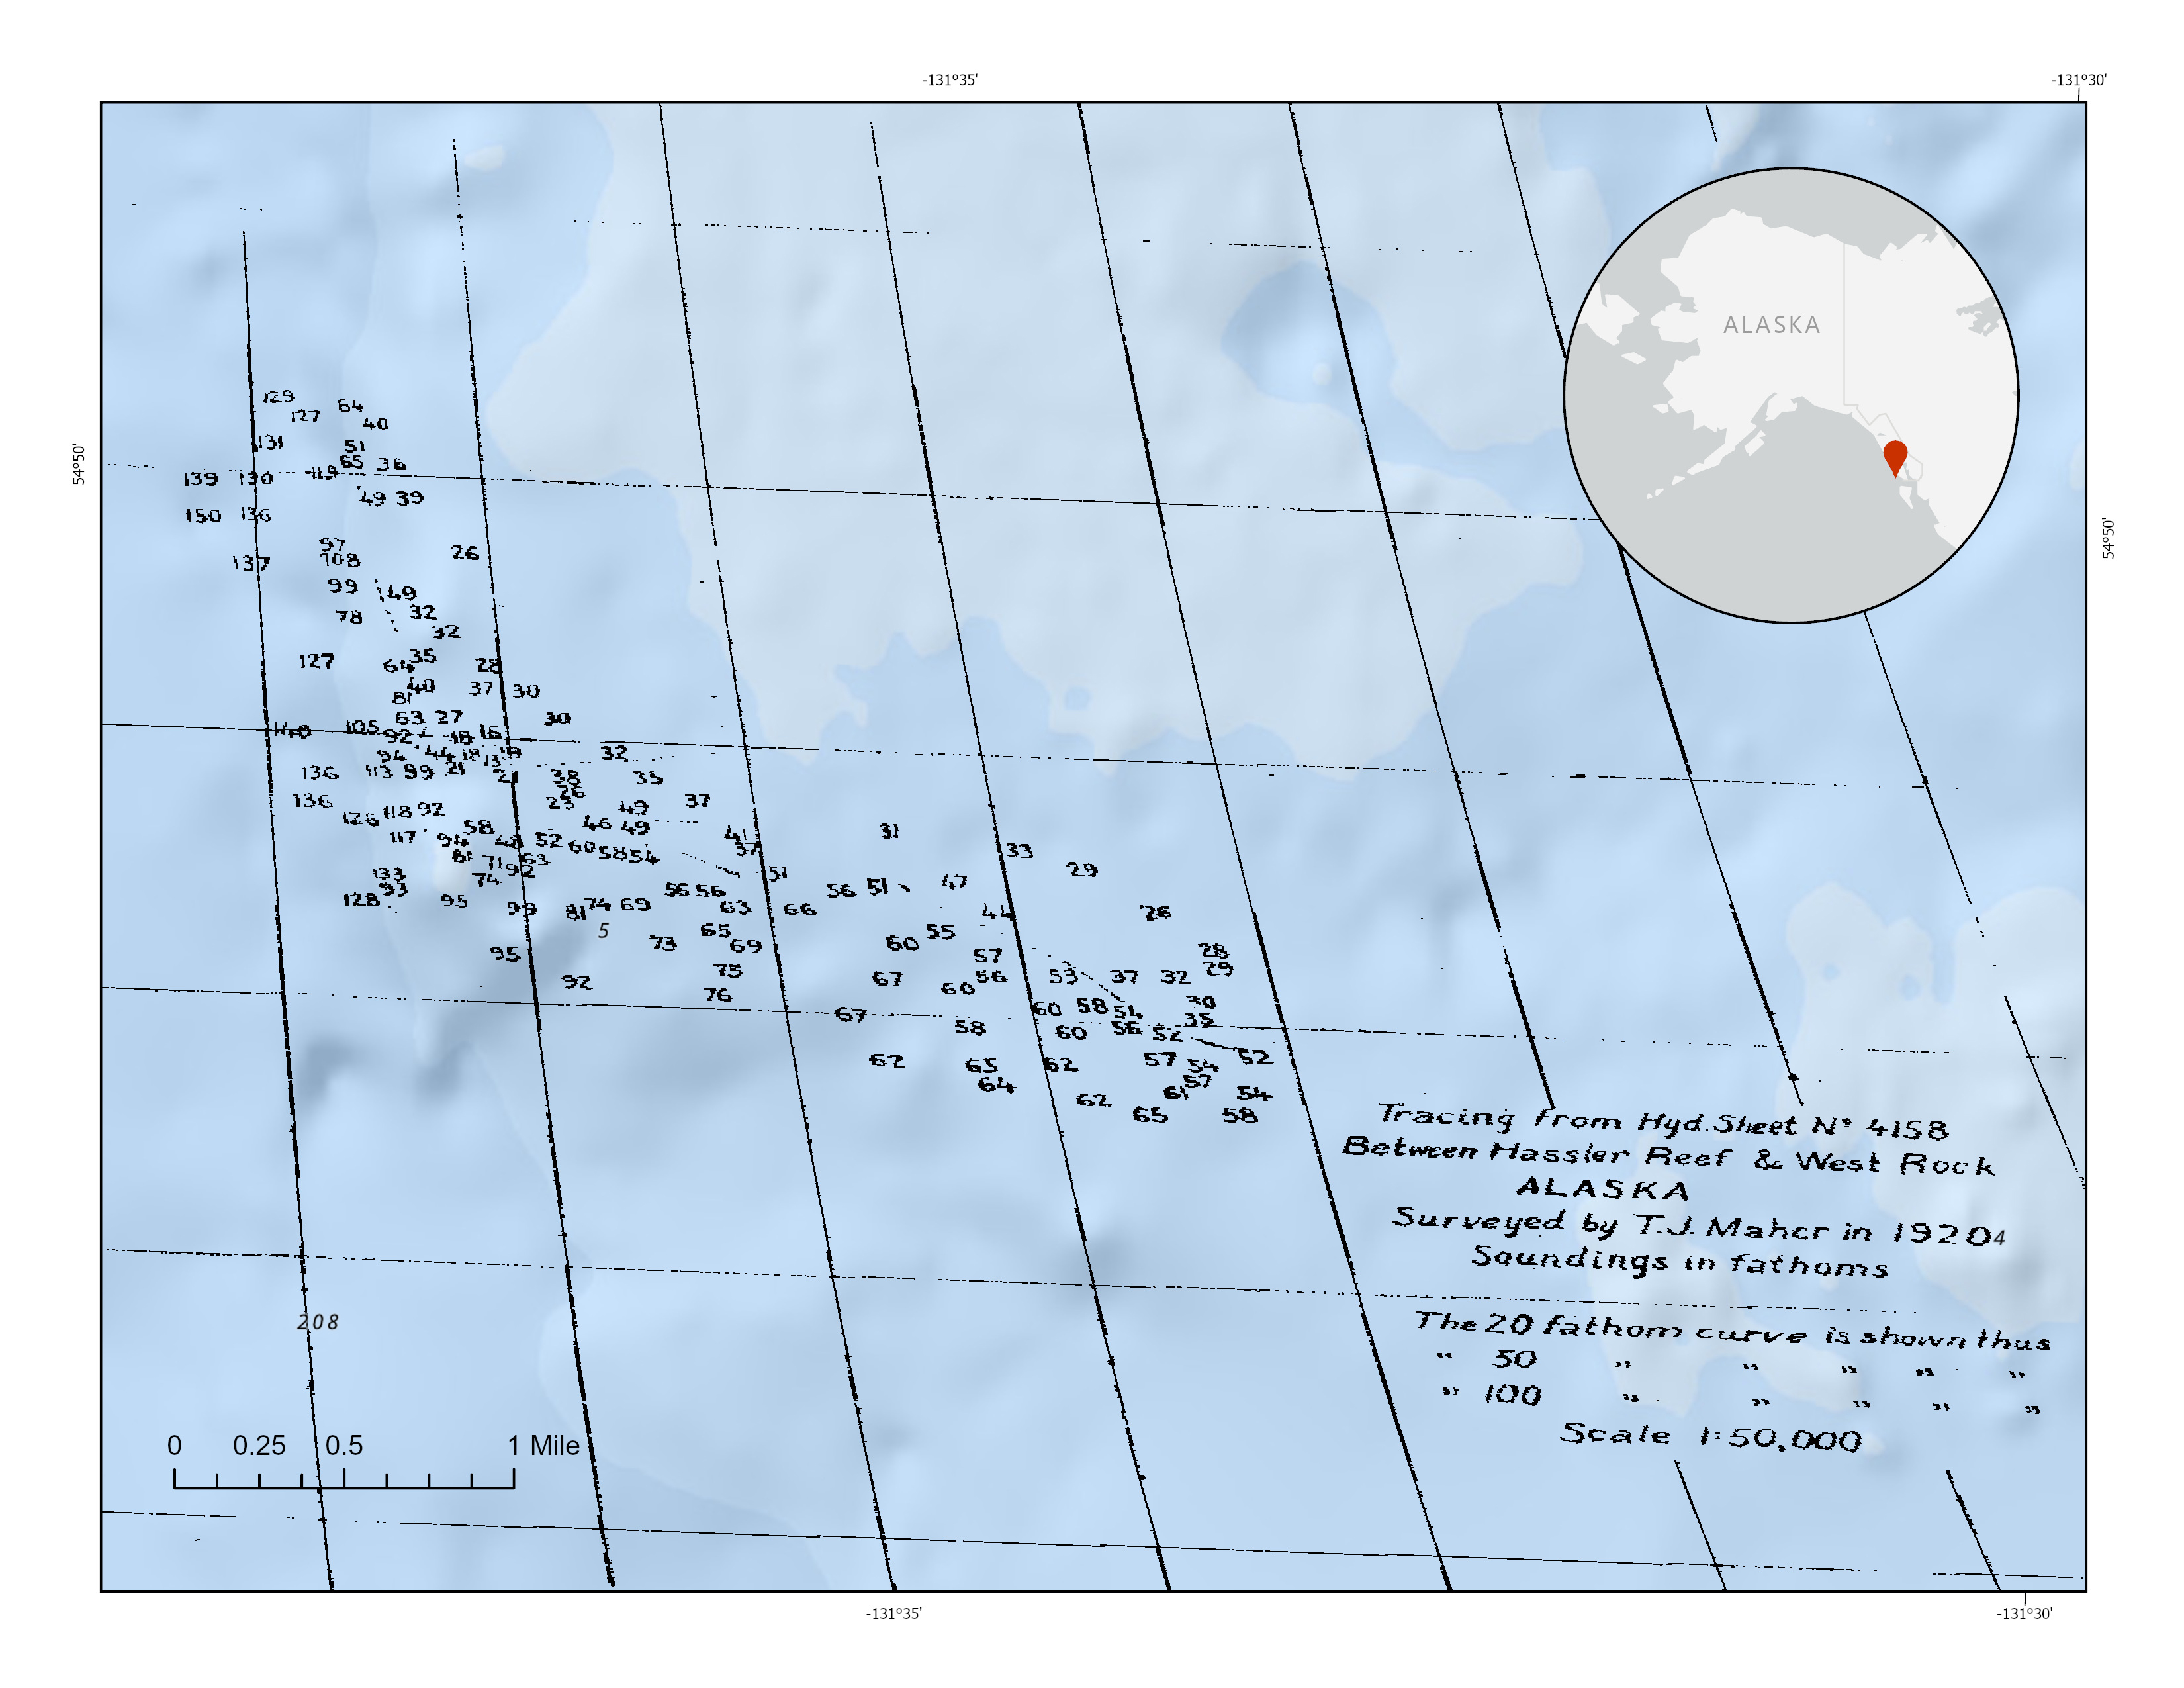
Image courtesy of NOAA
Download largest version (jpg, 1.9 MB).
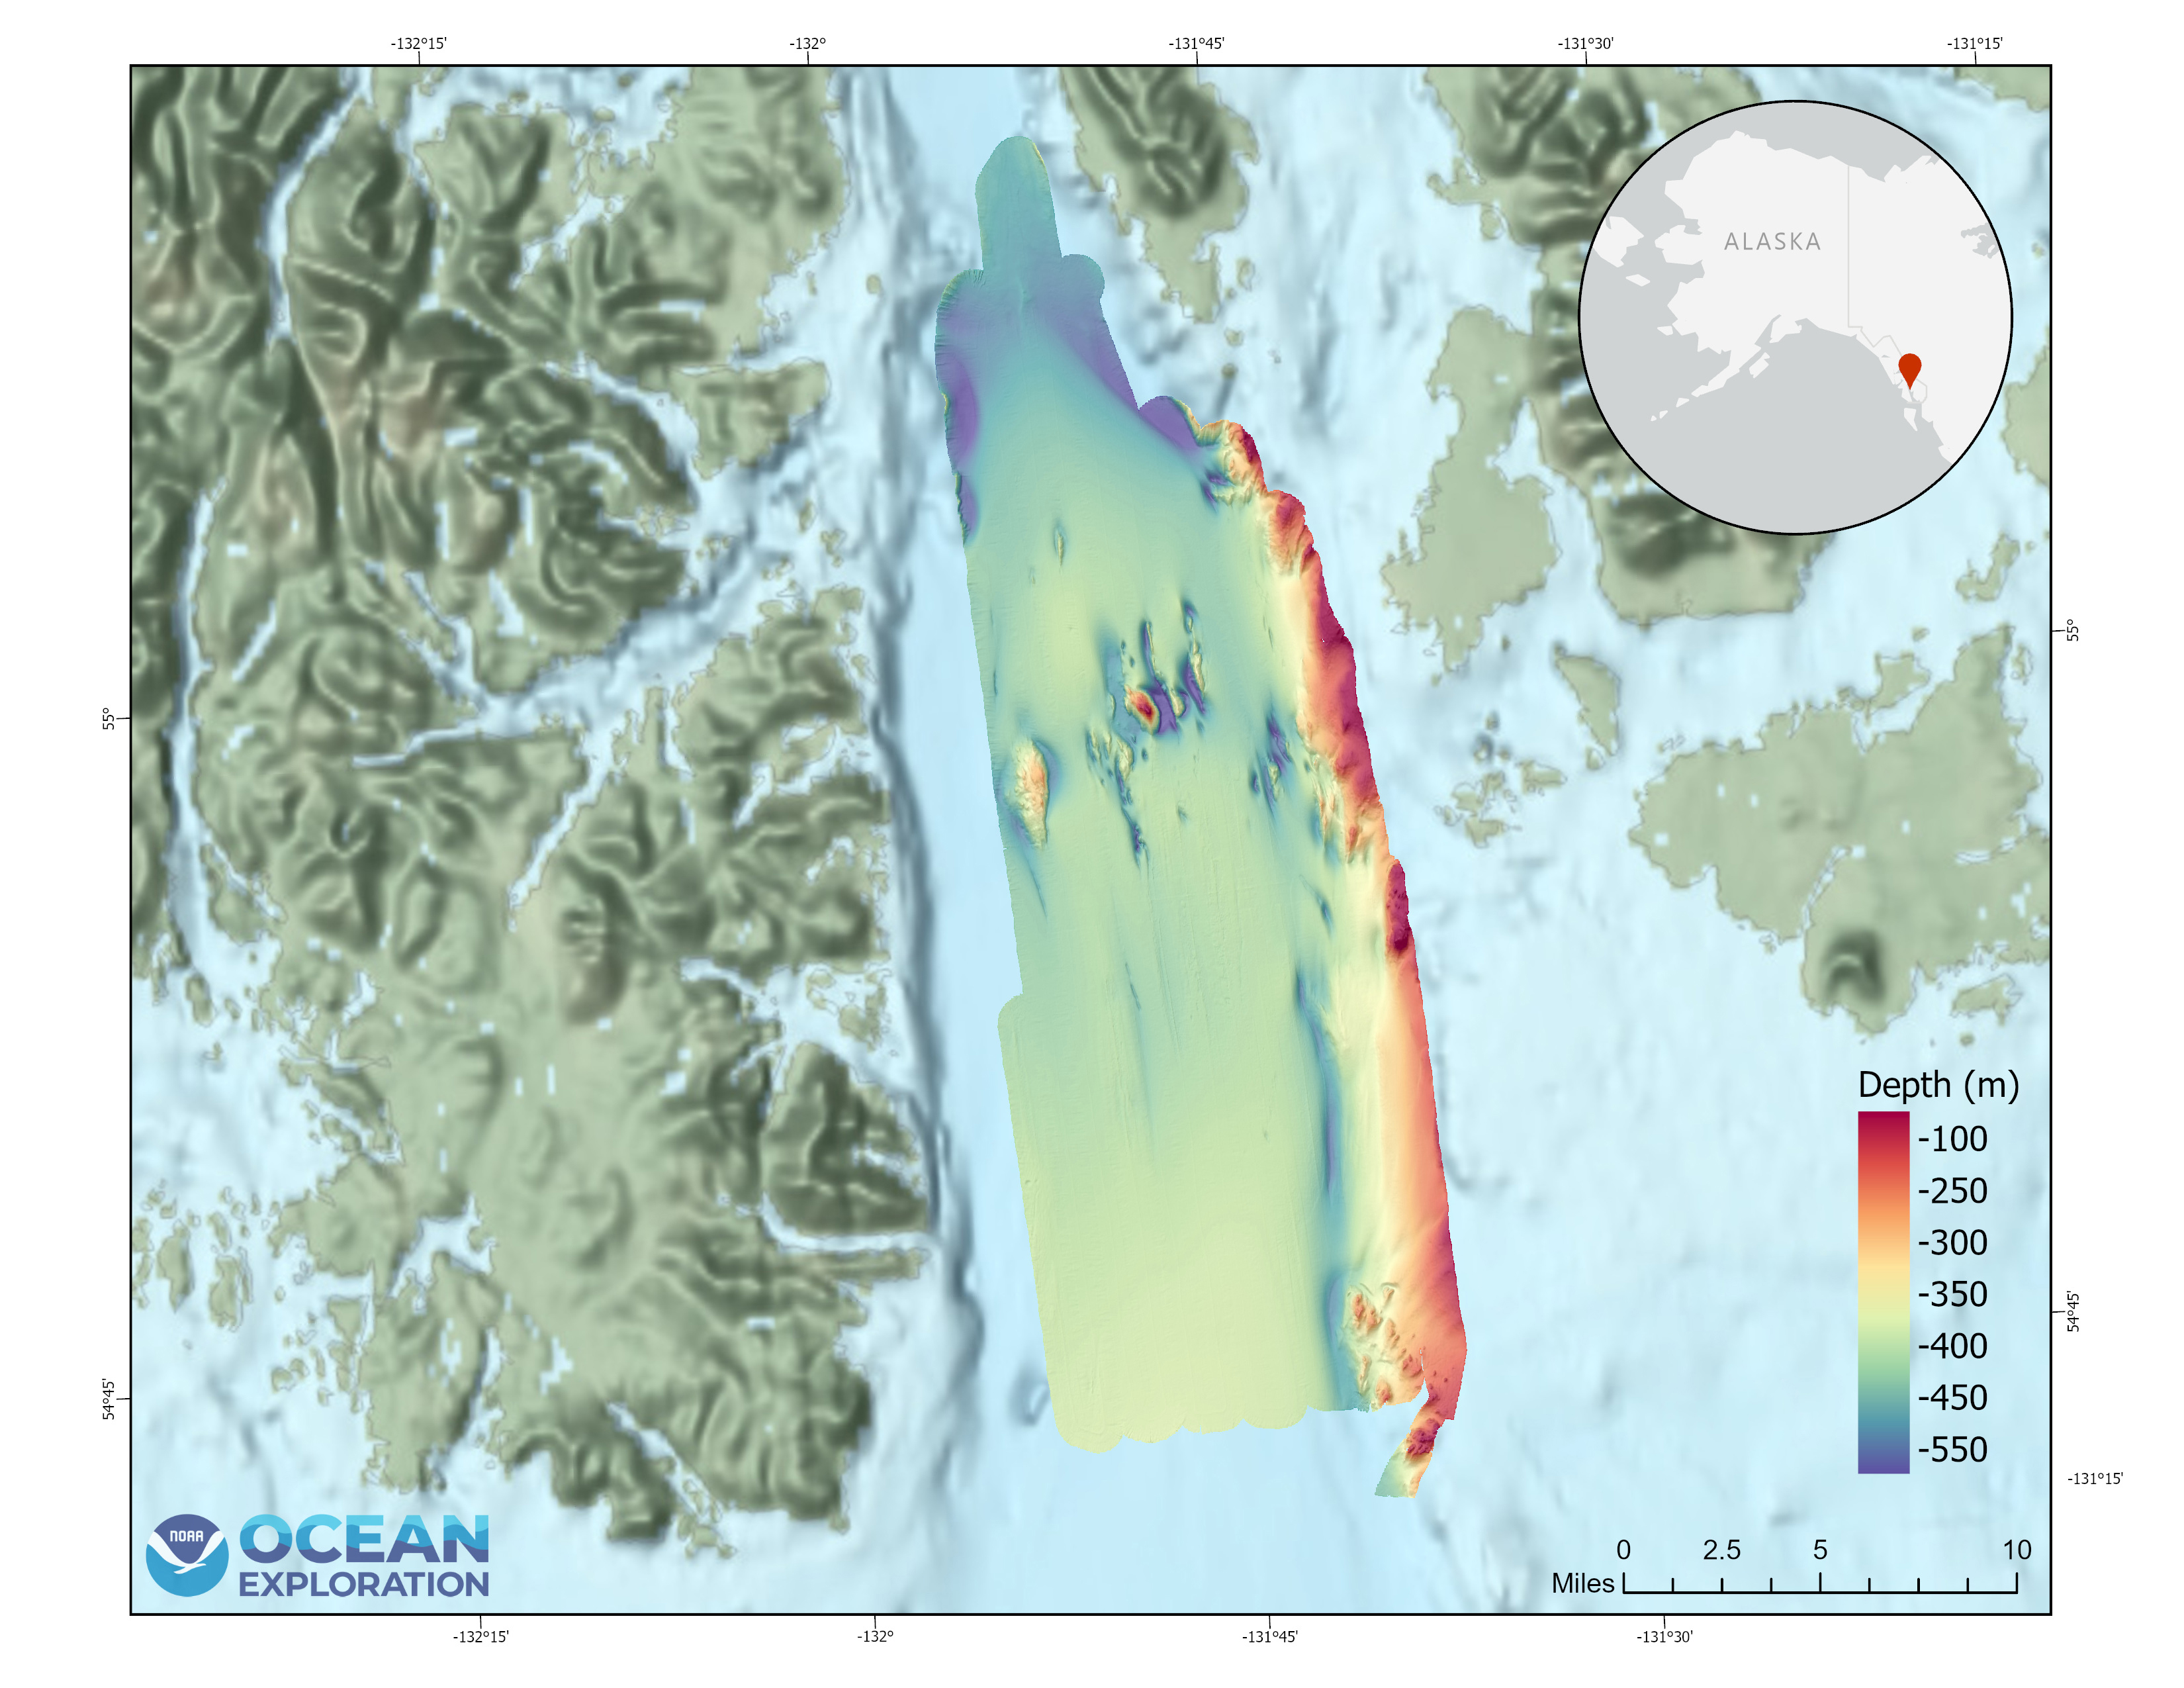
Image courtesy of NOAA Ocean Exploration, Seascape Alaska
Download largest version (jpg, 2.0 MB).
By Ingrid Martinson, NOAA Ocean Exploration Explorer-in-Training