
image
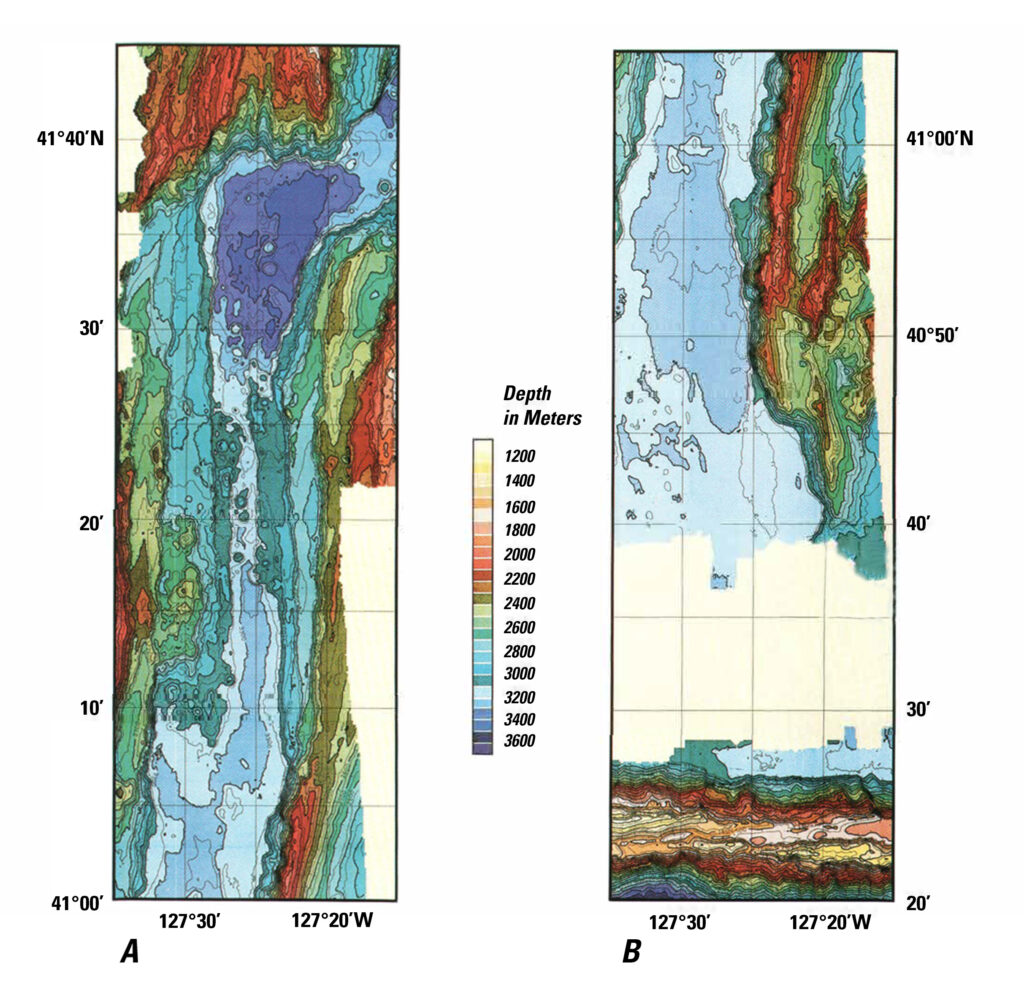
Bathymetry Map of Escanaba Trough
Image in public domain.
Sea Beam bathymetric map of Escanaba Trough from 1985. A, Northern half. B, Southern half. Contour interval is 50 m; each color change represents 100 m. Yellow indicates areas of no data.